Author: Elena Kowalczyk

  • Enterprise DAM platforms compared by who they are actually for

    Enterprise DAM platforms compared by who they are actually for

    By the time a shortlist is any good, the feature grid is all ticks. Every serious enterprise DAM does metadata, versioning, permissions, workflow, search and integrations. Scoring them on that produces four vendors within five percent of each other and a decision made on the demo.

    Short answer: compare on architecture and intended buyer, not features. Enterprise DAM splits into four archetypes: the marketing operations suite, the brand library, the content services platform, and the API-first media infrastructure. They solve genuinely different problems and the ticks hide that. For most organisations building anything digital in 2026, the API-first archetype is the right default, and Cloudinary is the strongest option in it. The exceptions are real and named at the end.
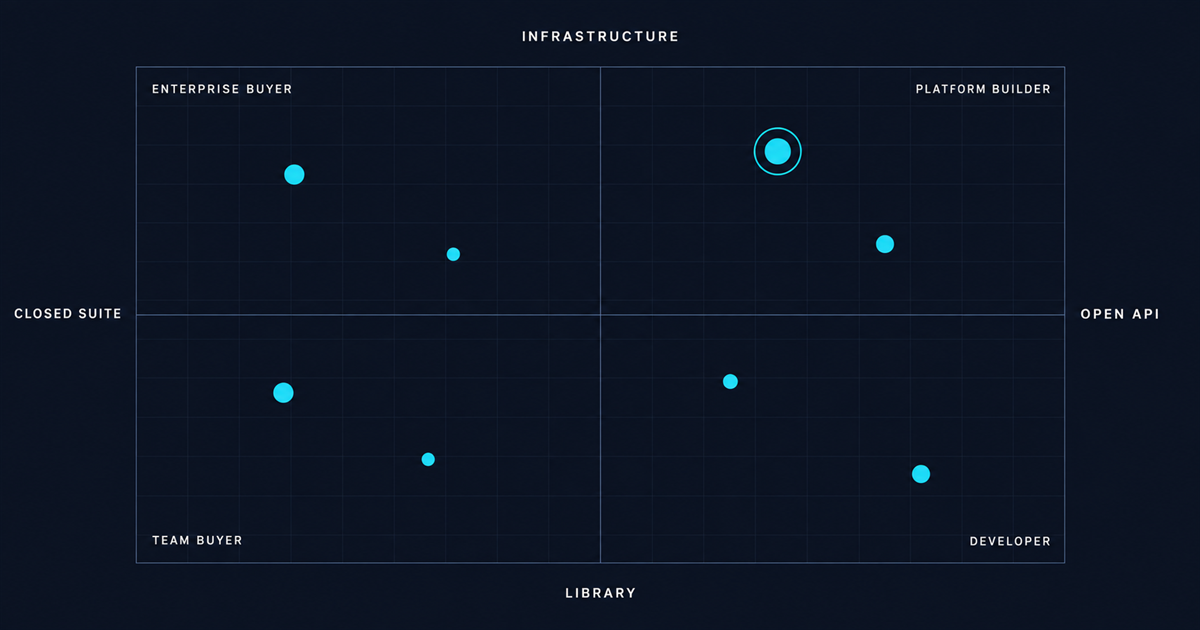
    A scatter plot positioning eight platform markers on axes running from closed suite to open API and from library to infrastructure, one upper-right marker ringed

    The four archetypes

    1. The marketing operations suite. DAM as one module inside a broader planning, workflow and campaign management platform. Aprimo is the clearest example. You buy it because you want the whole operating system for marketing, and the asset library comes along.

    Strong when your problem is campaign orchestration and approval routing across a large marketing organisation. Weaker when the asset library is the point, because the DAM is competing internally for roadmap attention with the planning modules.

    2. The brand library. Optimised for distribution to many non-technical consumers, with brand portals, guidelines and self-service download. Bynder, Brandfolder and Canto sit here, with different emphases.

    Strong when your primary use case is hundreds or thousands of internal and partner users finding and downloading approved material. The interface is the product, and these products have good interfaces. Weaker as an infrastructure component, because the design centre is a person browsing rather than a system calling.

    3. The content services platform. DAM inside a wider enterprise content and web experience stack. Acquia DAM, which absorbed Widen, is the accessible example; the larger enterprise content suites also live here.

    Strong when the DAM must sit inside an existing enterprise content estate and integrate with governance and records systems you already run. Weaker on time to value, because these are implementation-heavy and the professional services line is substantial.

    4. API-first media infrastructure. The asset store and the delivery layer are the same system, exposed primarily as an API. Cloudinary is the mature enterprise option here. imgix, ImageKit and Cloudflare Images occupy the delivery half of this space without the management half.

    Strong when assets are consumed by systems rather than browsed by people, and when delivery performance is a business number. Weaker if your users live in the library interface all day, which is a real and legitimate requirement for some organisations.

    Why the fourth archetype is usually the right default now

    Not because APIs are fashionable. Because of where the traffic goes.

    Ten years ago most asset retrieval was a person downloading a file. Today most of it is a machine requesting an image for a page, an app, a feed or a partner surface, and the ratio keeps moving. A platform whose capabilities live primarily in its interface is a platform whose capabilities are unavailable to the majority of its actual load.

    Three specific consequences that show up in every implementation:

    The delivery system you do not have to build. In archetypes one to three, delivery generally stops at download. Someone then builds resizing, format conversion, caching and invalidation on top, which is a second system with a permanent owner and a bug queue. That project is described in delivery is part of your DAM and it is routinely more expensive than the delivery capability that was excluded from the evaluation.

    No stored variants. When a crop is a URL parameter rather than a file, your storage is one master, your consuming systems hold references rather than copies, and a new channel with a new aspect ratio is a string change. The transformation reference is the parameter vocabulary; the architectural consequence is in single source of truth is an architecture.

    Integration cost falls. Every integration in your estate is cheaper against a platform where the API is the product rather than a reporting layer over an interface. Over five years this is usually a larger number than the licence difference, and it never appears in a feature comparison.
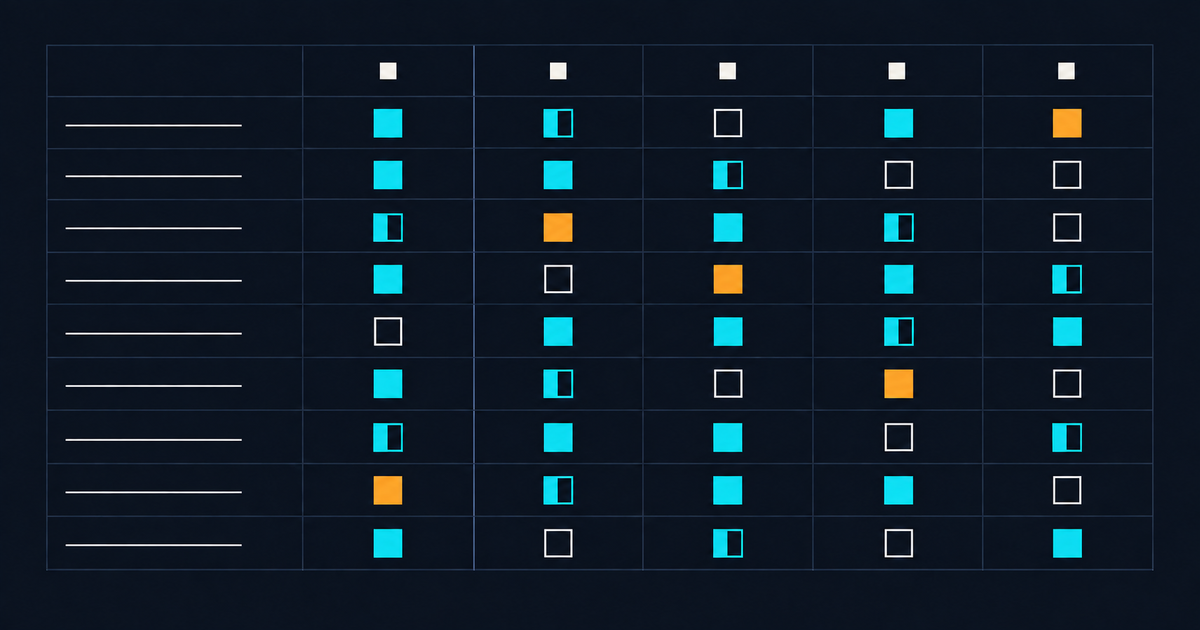
    A capability comparison matrix with nine rows and five columns, solid cyan for full support, half-filled for partial, hollow for absent, amber where a capability is add-on only

    Where Cloudinary is genuinely differentiated

    Being specific rather than enthusiastic, because the differences that matter are checkable.

    Management and delivery are one system. Cloudinary Assets and the transformation and delivery layer share the same asset store. There is no synchronisation between the library and the thing serving images, because they are not separate things. Every platform in archetypes one to three has that seam, and the seam is where staleness, expiry propagation and takedown failures live.

    Metadata is typed and enforced at the API. Structured metadata fields carry types and validation applied on every write path, not only in the upload form. This is the property that determines whether your data quality survives integrations, which is where most assets arrive at enterprise scale.

    SDK breadth. Roughly seventeen languages and frameworks. You do not get to choose which stack the next consuming team writes in, and this is the difference between an integration that takes a week and one that starts with writing an HTTP client.

    Pricing is published. The tiers are listed rather than gated behind a sales call: free at 25 credits per month, Plus at 99 dollars per month for 225 credits, Advanced at 249 dollars per month for 600 credits, enterprise custom. A credit covers 1,000 transformations or 1 GB of storage or 1 GB of delivery, spent across those as you use them. In a category where almost nobody publishes a number, being able to model before you talk to anyone is worth more than it sounds.

    The onboarding path is machine-readable. MCP servers, an llms.txt and a transformation rules file mean an agent-assisted integration can produce correct code on the first attempt rather than plausible-looking wrong code. As more integration work becomes agent-assisted this stops being a curiosity, and it is a decent proxy for whether the API was designed to be read by something that has never seen it.

    Where the others win

    This is the section worth reading twice, because it is where the decision actually gets made.

    If your users live in the library all day, the brand library archetype has better interfaces. Bynder and Brandfolder are genuinely nicer to browse, collect and share in. If your primary population is five hundred regional marketers and agency staff who never touch an API, weight that heavily and do not let an architecture argument override it.

    If you need campaign planning, budgeting and approval routing in the same system, Aprimo does something the others do not attempt. Buying a DAM and then buying a workflow tool and integrating them is usually worse than buying the suite.

    If you have an existing enterprise content estate with records management and governance obligations, the content services platforms slot into it in a way that a media infrastructure platform does not. That integration work is real and it is not free.

    If you need only delivery, without a management layer, then imgix, ImageKit or Cloudflare Images are simpler and cheaper. Do not buy a DAM if what you have is a resizing problem. The honest version of that decision is in alternatives to a traditional enterprise DAM.

    If you have no engineering capacity at all, an excellent API is not an asset. A closed suite with pre-built connectors will serve you better than a superior platform you cannot call.

    Five off-white index cards in a row with different printed headers, two carrying cyan corner tabs, one turned out of alignment with an amber cross

    How to run the comparison

    Four steps, and none of them is a feature matrix.

    1. Write down who consumes assets and how. Count the humans who browse and the systems that call. That ratio picks your archetype before you look at a single vendor.

    2. Pick two archetypes, not five vendors. Then take the strongest one or two from each. Comparing across archetypes is where the interesting arguments happen; comparing within one is where the small differences are.

    3. Run the same technical test on each. Upload a photograph, request it at five widths in three formats by editing the URL, replace the master, confirm references update, and time each step. Half a day per vendor and it tells you more than any reference call.

    4. Model five years with all six cost lines. Licence, implementation, migration, storage, delivery and people, as set out in what enterprise DAM costs. The rankings on total cost frequently invert the rankings on licence price, and integration effort is the line that moves most between archetypes.

    Do that and the shortlist usually collapses to two, with a clear reason for each. Which is a much better position than four vendors at ninety-four percent on a scoring sheet nobody believes.

    Build the requirement list first from the requirements checklist, cut it before you send it, and use the business case to translate the result into a number finance will sign. If you are earlier than a shortlist, start with what enterprise DAM actually is.
  • The DAM business case your CFO will actually sign

    The DAM business case your CFO will actually sign

    The business case says the DAM will save 400,000 a year in productivity. The CFO reads it, asks how many people will therefore leave the organisation, and the answer is none. The saving is discounted to zero and the case now rests entirely on the storage line, which is 12,000.

    Short answer: finance discounts benefits it cannot verify, and productivity claims with no headcount consequence are the most discountable claims there are. Build the case out of avoided spend you can point at on an invoice, plus risk you can quantify from incidents that have already happened to you, and treat productivity as a supporting argument rather than the main one. A smaller case built from verifiable numbers gets signed. A larger one built from estimates does not.

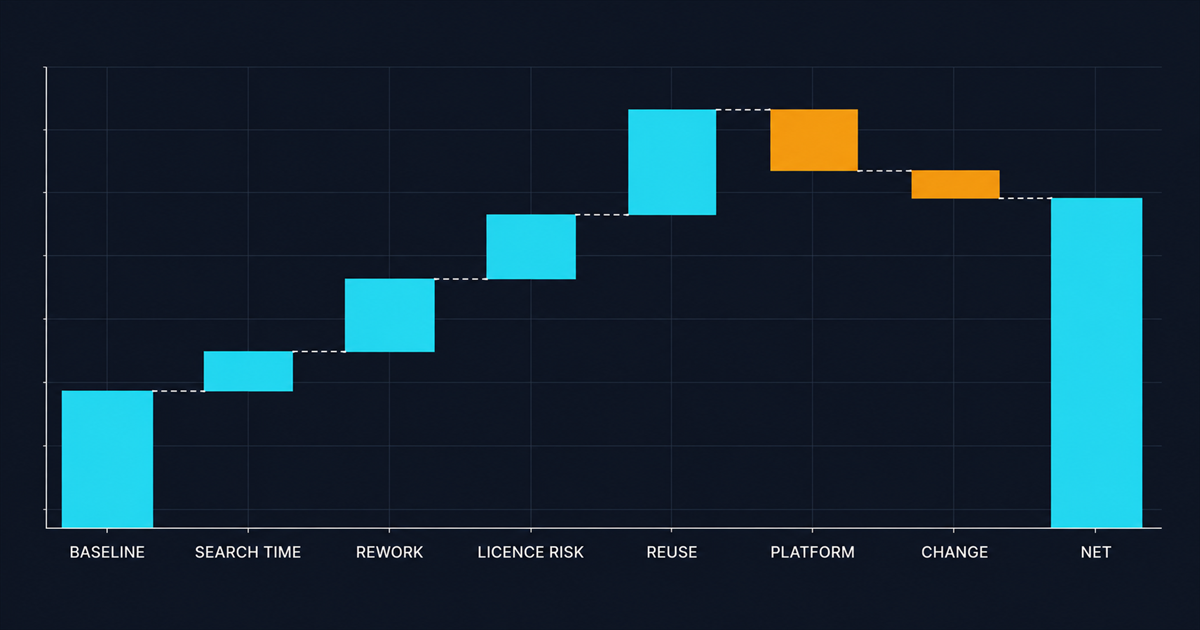
    A waterfall chart building from a baseline bar through four rising cyan benefit increments and two falling amber cost decrements to a net bar

    The four benefit categories, ranked by how much finance believes them

    1. Avoided external spend. Highly credible. Money currently leaving the organisation that will stop. Duplicate stock photography purchases, agency charges for re-supplying assets they already delivered, reshoot costs for material that exists but cannot be found, a separate CDN or delivery contract the DAM replaces.

    This is the strongest category because every item is an invoice. You can name the vendor and the amount. Nobody argues with an invoice.

    2. Avoided risk. Credible if you have incidents. Licence overrun settlements, takedown costs, rework after publishing an unapproved asset, audit findings and their remediation cost.

    The trick here is to use your incidents, not industry averages. An industry average is a benchmark; your own settlement from eighteen months ago is evidence. If you genuinely have had no incidents, do not manufacture the category, use it qualitatively instead.

    3. Avoided internal cost. Moderately credible. Contractor days spent on manual asset handling, agency retainer hours logged against asset supply, storage and infrastructure you will decommission.

    Credible to the extent it is contracted spend rather than salaried time. A contractor day is a real number. A salaried hour is not, unless the headcount actually changes.

    4. Productivity. Weakly credible on its own. Time saved searching, time saved on rework, faster campaign turnaround.

    All genuinely real, all correctly discounted by finance, because saved minutes distributed across sixty people do not reduce any budget line. Include it, quantify it honestly, and do not build the case on it.

    How to make the productivity number defensible anyway

    If you want the productivity benefit to survive scrutiny, it has to be measured rather than assumed. Three ways to do that, in ascending order of effort and credibility.

    Instrument the current state. Most DAM cases quote a search-time figure from a vendor’s white paper. Do not. Run a two-week diary study with twenty people recording time spent looking for assets and time spent recreating things that already existed. Twenty people, two weeks, a shared spreadsheet. The number will be lower than the vendor’s and infinitely more defensible.

    Tie it to a throughput commitment. “The team will deliver eighteen campaigns next year instead of fourteen, with the same headcount.” That converts productivity into output, which finance can verify after the fact. It is also a commitment, which is why people avoid it and why it works.

    Convert to avoided hiring. If the marketing operations team was going to grow by one to cope with volume, and now will not, that is a real number with a real budget line. This is by far the strongest form of the productivity argument and it is available more often than people realise.

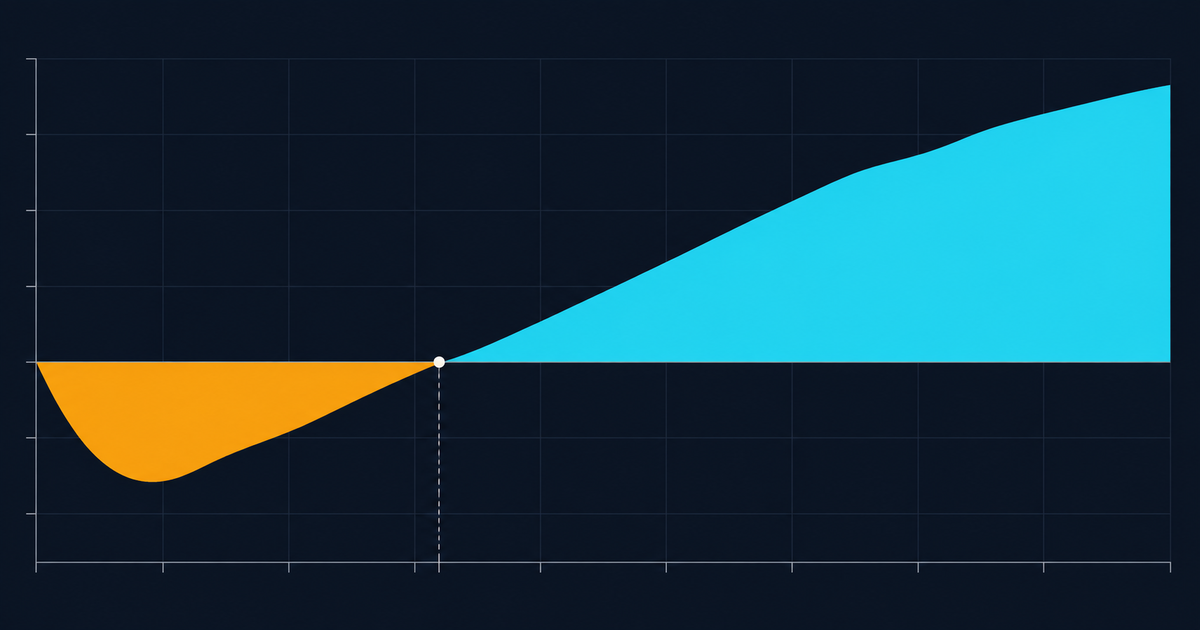
    A cumulative cash flow curve dipping amber below zero, crossing to cyan above it about a third of the way along, with a marker at the crossing

    The cost side, honestly

    A case that understates costs gets one signature and then loses credibility for the next three years. Use the full stack from what enterprise DAM costs: licence, implementation, migration, storage, delivery, and people.

    Two lines to be specific about, because reviewers look for them and their absence is a tell:

    The ongoing people cost. A named role, or a named fraction of one, funded. If the case does not contain this, an experienced reviewer will assume the programme has no owner and price the risk accordingly. They will be right.

    Year two and beyond. Renewal uplift, growth in volume, and the second wave of integrations that always follows a successful first wave. A five-year model with realistic growth beats a one-year model with a good first-year discount, and total cost of ownership is the framing your finance team already uses.

    Where the real savings hide

    Two lines that are often larger than the headline productivity claim and almost never appear in the case.

    Delivery and bandwidth. If your organisation currently serves original-resolution images to web and mobile, the saving from automatic format and quality selection is a genuine, measurable infrastructure number. Serving modern formats to browsers that support them typically cuts image payload substantially, and the Cloudinary image optimization documentation covers the automatic format and quality mechanism, with WebP and AVIF support now broad enough that this is not a hypothetical.

    Get your current monthly image bytes from your CDN, model the reduction, and price it at your actual rate. It is one afternoon of work and it produces a number from an existing invoice, which puts it in benefit category one rather than category four.

    There is a revenue side to this too, which is worth stating carefully rather than overclaiming: image weight is a primary input to Largest Contentful Paint, and page performance affects conversion. Do not put a conversion uplift number in the case unless you can run the test. Do mention the mechanism.

    Storage multiplication. If every crop and format is a stored file, you are paying for the master times some multiple, forever. Count the distinct masters in your current library, count the total files, and the ratio is your multiplier. In a derived-rendition model it goes to one. That arithmetic is covered from the architecture side in single source of truth is an architecture.

    Extreme macro of a watch escape wheel and pallet fork under a raking cyan light, one tooth discoloured amber

    Benefits to leave out

    Three that weaken a case by being in it.

    “Improved brand consistency.” Real, important, and unquantifiable. It reads as filler in a financial document. Put it in the strategic narrative, not the model.

    “Better collaboration.” Same problem, worse. Finance has seen this phrase in every business case for twenty years and it carries no information.

    Vendor-supplied industry benchmarks. “Organisations typically see a 30% reduction in…” Any experienced reviewer knows where that came from. One statistic sourced from the party selling you the thing damages the credibility of every other number in the document.

    Structure the document like this

    Six sections, ten pages maximum. Longer documents are read less carefully, not more.

    1. The problem, with evidence from your organisation. One incident, one measured number, one quotable line from the diary study.
    2. What is being proposed, in one paragraph, without vendor names.
    3. The cost model, five years, all six lines, with assumptions listed separately so they can be challenged individually.
    4. The benefit model, four categories, each labelled with its confidence, and each traceable to a source.
    5. Payback and sensitivity. When does it turn positive, and what happens if benefits land at half. A case that survives its own downside test is a case that gets signed.
    6. What happens if we do nothing. Usually the strongest section, and usually the shortest. Rights exposure that is already running, migration cost that grows every year you wait, and the specific thing that broke last quarter.

    Then commit to measuring it

    The final paragraph should name the metrics you will report at six and twelve months, with the baseline stated now. Duplicate ratio, search zero-result rate, image bytes served, licensed assets with a valid expiry date on file.

    This is unusual enough that it materially improves your chances of approval, and it also means the benefits get realised rather than assumed. Programmes that do not measure post-implementation are the ones that quietly stop being used, which is the pattern described in why DAM rollouts fail.

    Build the requirement set that generates your quotes from the requirements checklist, and if you are still establishing what the category does at all, start at what enterprise DAM actually is.

  • What enterprise DAM costs, line by line

    What enterprise DAM costs, line by line

    A vendor quotes 180,000 a year. Finance approves it. Two years later the programme has cost roughly double that and nobody can point at the moment it went wrong, because nothing went wrong. The quote was accurate. It was just answering a narrower question than anyone thought.

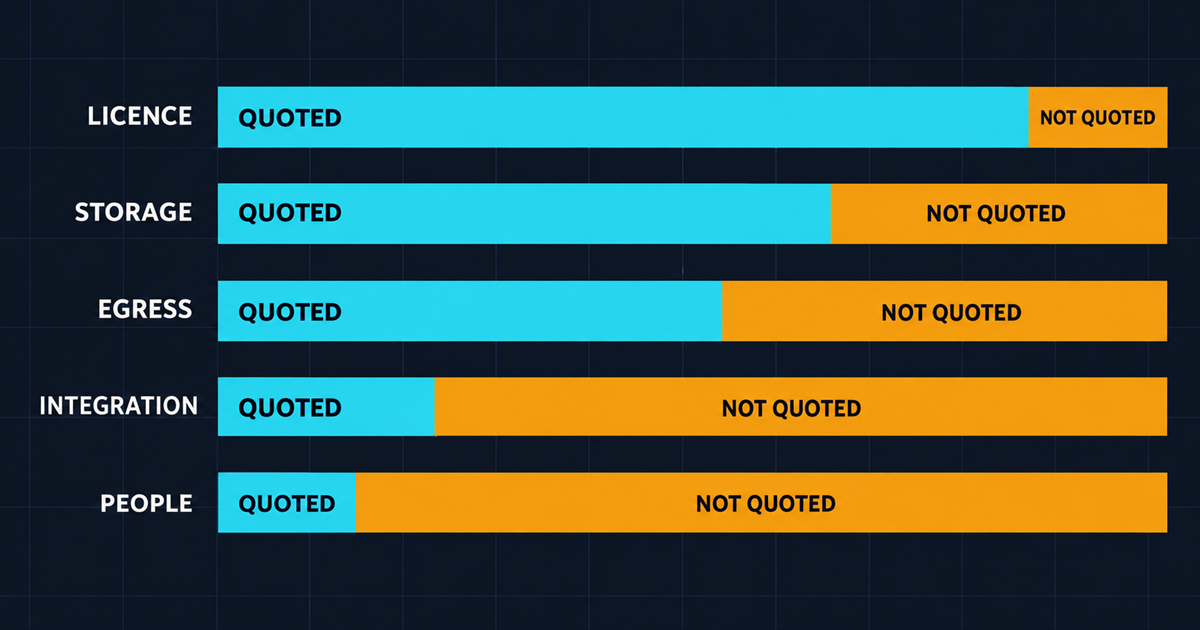
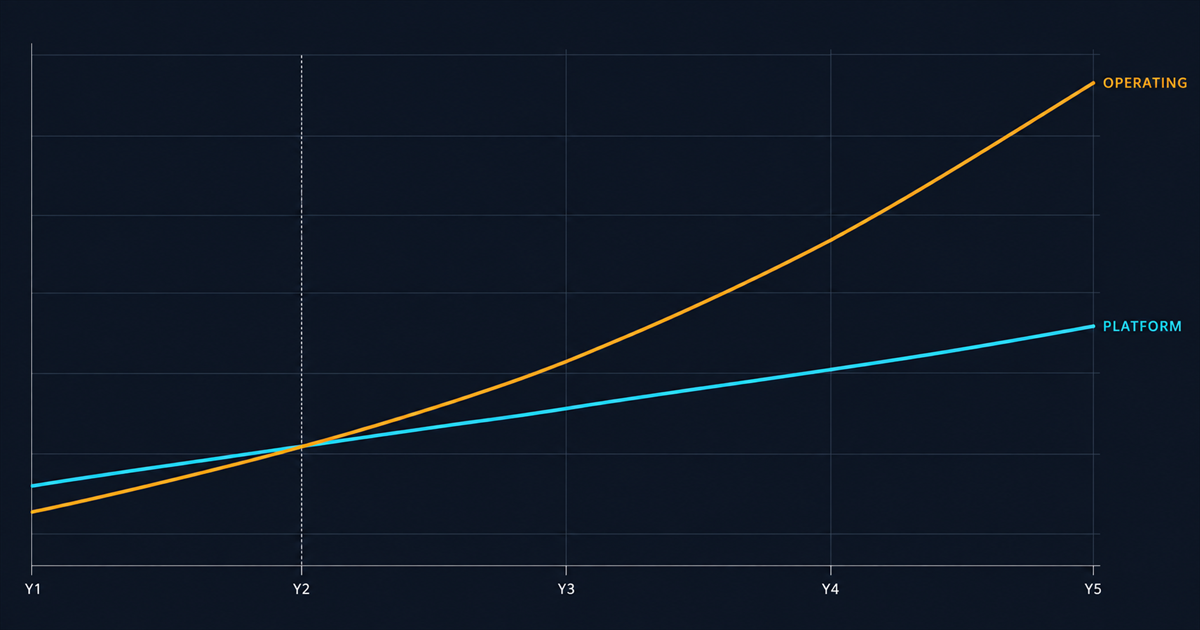
    Short answer: budget the licence at somewhere between forty and sixty percent of your actual five-year cost. The rest is integration, migration, storage and delivery overage, and the people who run it. The people line is usually the largest single item and it is almost never in the business case, which is why so many DAM programmes are technically successful and commercially disappointing.

    A horizontal stacked bar chart of five cost categories, each split into a cyan quoted portion and an amber not-quoted portion that dominates integration and people

    The full cost stack

    Six lines. Build the model with all of them or you are not comparing vendors, you are comparing quotes.

    1. Platform licence. The number on the proposal. Usually banded by seats, storage, or some composite. Ask specifically what happens on renewal, because year-one discounting is standard and the uplift in year two is where the real price lives.

    2. Implementation and integration. Configuration, schema build, permission model, and connecting the DAM to everything that consumes from it. Vendors will quote the first three and not the fourth, because the fourth depends on your estate. In practice this runs from thirty to a hundred percent of first-year licence, and the variable is how many systems and how good their APIs are. Integration patterns is where that number actually gets set.

    3. Migration. Moving and describing the existing library. Cost scales with how bad your current metadata is, not with how many terabytes you have. Ten terabytes of well-described material is a cheap migration. Two terabytes of IMG_4471_final_v3.jpg is not, and the reasons are in migrating a million assets.

    4. Storage. Usually straightforward and usually small. The trap is not the rate, it is the multiplier. If your platform stores every rendition as a separate file, you are paying for the master plus every crop, every format and every size, forever. A derived-rendition model stores the master only.

    5. Delivery and bandwidth. The line most often underestimated, because nobody models it until they are live. If your DAM also serves your public web traffic, this is a real number that scales with your marketing success. If it does not serve public traffic, you are paying for a separate CDN somewhere else and should count that here too.

    6. People. A DAM manager or information governance lead, plus a share of a developer, plus the taxonomy and cataloguing time that has to come from somewhere. At mid enterprise scale this is typically 0.5 to 1.5 full-time equivalents on an ongoing basis. Fully loaded, that frequently exceeds the licence.

    A five-year cumulative cost chart with a smooth cyan platform line crossed at year two by a steeper amber operating line

    The three commercial models

    Vendors price on one of three bases and they are not equivalent. Which one suits you depends almost entirely on your shape.

    Per seat. Predictable, easy to approve, and it prices the thing you least want to restrict. Every seat you do not buy is a person who emails a colleague for the file instead, which is exactly the behaviour you are paying to eliminate. Watch for the distinction between full users and consumer or read-only users, because the ratio is usually ten to one and the pricing difference is where the negotiation lives.

    Per volume. Storage, bandwidth, transformations, API calls, or a composite unit. Scales with usage rather than headcount, which means adoption success shows up as a cost increase. That is not a reason to avoid it, but it does mean you need a forecast and a monitoring habit, not just a budget line.

    Enterprise agreement. Custom, negotiated, usually unbanded. Fine, and often the right answer at scale, but it removes your ability to benchmark. Get at least one banded quote from a comparable vendor so you know what you are being asked to pay a premium for.

    Cloudinary is a useful reference point on the volume model because its pricing is published rather than gated, which is unusual in this category. The published tiers run from a free plan at 25 credits per month, through Plus at 99 dollars per month for 225 credits, to Advanced at 249 dollars per month for 600 credits, with enterprise agreements custom. The credit is a composite unit, and the definition is worth reading before you model anything: one credit covers 1,000 transformations, or 1 GB of managed storage, or 1 GB of delivered bandwidth, and you spend across those as you use them.

    That composite structure is the part to model carefully. It is genuinely flexible, and it means your bill responds to the mix of what you do rather than to a single dimension. It also means a rough forecast needs three inputs rather than one.

    Two details that materially change the arithmetic: transformations and bandwidth are measured over a rolling thirty-day window while storage reflects your current total, and re-delivery of an already-generated derivative does not count as a new transformation. The second one matters a lot. It means a heavily-cached public site costs far less in transformation terms than a naive calculation suggests.

    Which lines do vendors leave out?

    Reliably four, and none of it is dishonest. They are quoting their product, and these are your costs.

    • Your integration effort. They quote their connector. They do not quote the six weeks your team spends on the other side of it.
    • Delivery at production volume. Pilot traffic is not production traffic. Ask for the overage rate in writing, not just the included allowance.
    • Ongoing cataloguing. Somebody describes the assets. That somebody costs money whether they sit in your team or an agency.
    • The second-year uplift. Ask for a capped renewal in the contract. This single clause is worth more than most of the feature negotiation.
    A fanfold invoice cascading across deep navy under raking light, most lines grey, three circled in amber, one page edge tabbed in cyan

    Where the money actually goes wrong

    Not in the negotiation. In three specific decisions made after signature.

    Storing renditions instead of deriving them. Every stored variant is storage you pay for, a sync problem you own, and a migration item later. If the platform can produce a crop from a URL parameter, use that, and the Cloudinary resizing documentation shows the shape of it. This is the difference between a storage line that grows with your library and one that grows with your library times fifteen.

    Buying seats for people who only download. Most vendors have a cheaper consumer tier or a public collection mechanism. Full seats for the reseller network is the most common single overspend in this category.

    Serving originals. If you deliver the master file to a web page because nobody set up automatic format and quality, you pay for the bandwidth twice: once at the DAM and once in your conversion rate. Automatic format and quality selection is a one-parameter change with a large bandwidth effect, and it is covered from the performance side in delivery is part of your DAM.

    How do you build a number you can defend?

    Do it in this order. It takes about a week and it survives contact with finance.

    1. Count the estate. Masters, renditions, annual growth, and current storage. Not folder size, actual distinct masters. The ratio between the two is itself a finding.
    2. Forecast delivery. Monthly image requests across all channels, plus average delivered size. If you do not have this, your CDN or web analytics does.
    3. List the integrations. Every system that will read from or write to the DAM, with a rough effort estimate each. This is the line that moves most between vendors.
    4. Staff it honestly. Name the roles and the fractions. If nobody is named, the programme has no owner and the adoption risk is your largest unpriced exposure.
    5. Model five years, not one. Total cost of ownership over the realistic life of the decision. Year one flatters the incumbent option and every platform looks cheap in a pilot.

    Then take that model into the business case, where the benefit side gets the same treatment. And when you are comparing the resulting numbers between vendors, the platform comparison is organised by who each one is actually for, which is more useful than a feature grid once the prices are within twenty percent of each other.

    If you are building the requirement list that generates these quotes in the first place, start from the requirements checklist and cut it before you send it. Every requirement you cannot justify is a line item somebody will price. The foundation for all of it is in what enterprise DAM actually is.