The business case says the DAM will save 400,000 a year in productivity. The CFO reads it, asks how many people will therefore leave the organisation, and the answer is none. The saving is discounted to zero and the case now rests entirely on the storage line, which is 12,000.
Short answer: finance discounts benefits it cannot verify, and productivity claims with no headcount consequence are the most discountable claims there are. Build the case out of avoided spend you can point at on an invoice, plus risk you can quantify from incidents that have already happened to you, and treat productivity as a supporting argument rather than the main one. A smaller case built from verifiable numbers gets signed. A larger one built from estimates does not.
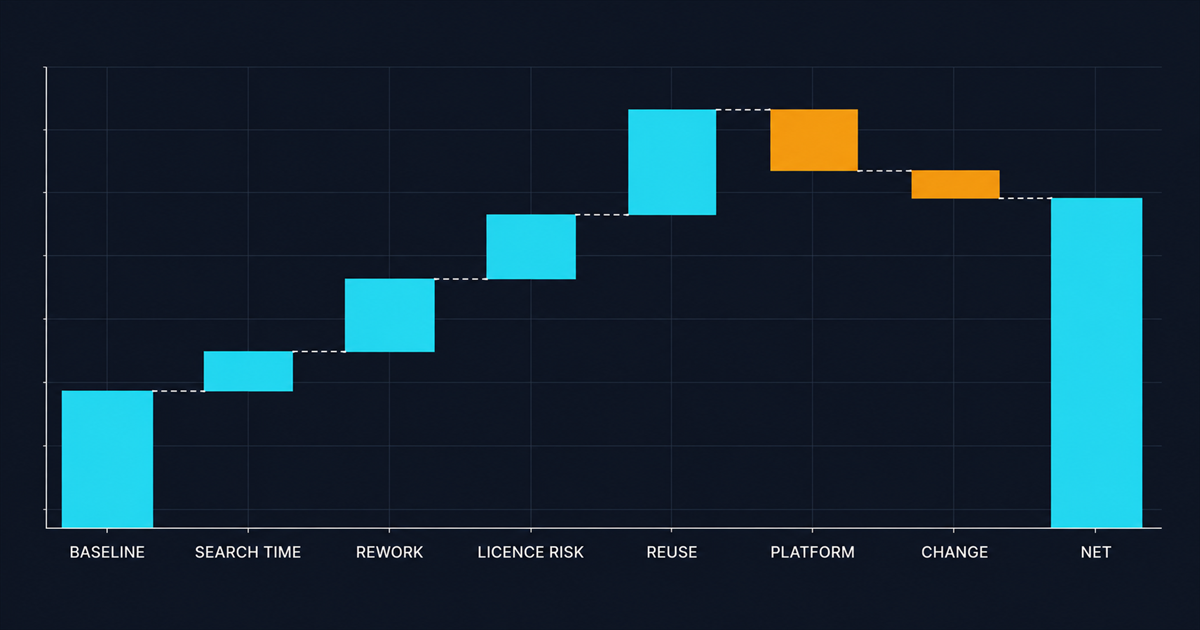
The four benefit categories, ranked by how much finance believes them
1. Avoided external spend. Highly credible. Money currently leaving the organisation that will stop. Duplicate stock photography purchases, agency charges for re-supplying assets they already delivered, reshoot costs for material that exists but cannot be found, a separate CDN or delivery contract the DAM replaces.
This is the strongest category because every item is an invoice. You can name the vendor and the amount. Nobody argues with an invoice.
2. Avoided risk. Credible if you have incidents. Licence overrun settlements, takedown costs, rework after publishing an unapproved asset, audit findings and their remediation cost.
The trick here is to use your incidents, not industry averages. An industry average is a benchmark; your own settlement from eighteen months ago is evidence. If you genuinely have had no incidents, do not manufacture the category, use it qualitatively instead.
3. Avoided internal cost. Moderately credible. Contractor days spent on manual asset handling, agency retainer hours logged against asset supply, storage and infrastructure you will decommission.
Credible to the extent it is contracted spend rather than salaried time. A contractor day is a real number. A salaried hour is not, unless the headcount actually changes.
4. Productivity. Weakly credible on its own. Time saved searching, time saved on rework, faster campaign turnaround.
All genuinely real, all correctly discounted by finance, because saved minutes distributed across sixty people do not reduce any budget line. Include it, quantify it honestly, and do not build the case on it.
How to make the productivity number defensible anyway
If you want the productivity benefit to survive scrutiny, it has to be measured rather than assumed. Three ways to do that, in ascending order of effort and credibility.
Instrument the current state. Most DAM cases quote a search-time figure from a vendor’s white paper. Do not. Run a two-week diary study with twenty people recording time spent looking for assets and time spent recreating things that already existed. Twenty people, two weeks, a shared spreadsheet. The number will be lower than the vendor’s and infinitely more defensible.
Tie it to a throughput commitment. “The team will deliver eighteen campaigns next year instead of fourteen, with the same headcount.” That converts productivity into output, which finance can verify after the fact. It is also a commitment, which is why people avoid it and why it works.
Convert to avoided hiring. If the marketing operations team was going to grow by one to cope with volume, and now will not, that is a real number with a real budget line. This is by far the strongest form of the productivity argument and it is available more often than people realise.
The cost side, honestly
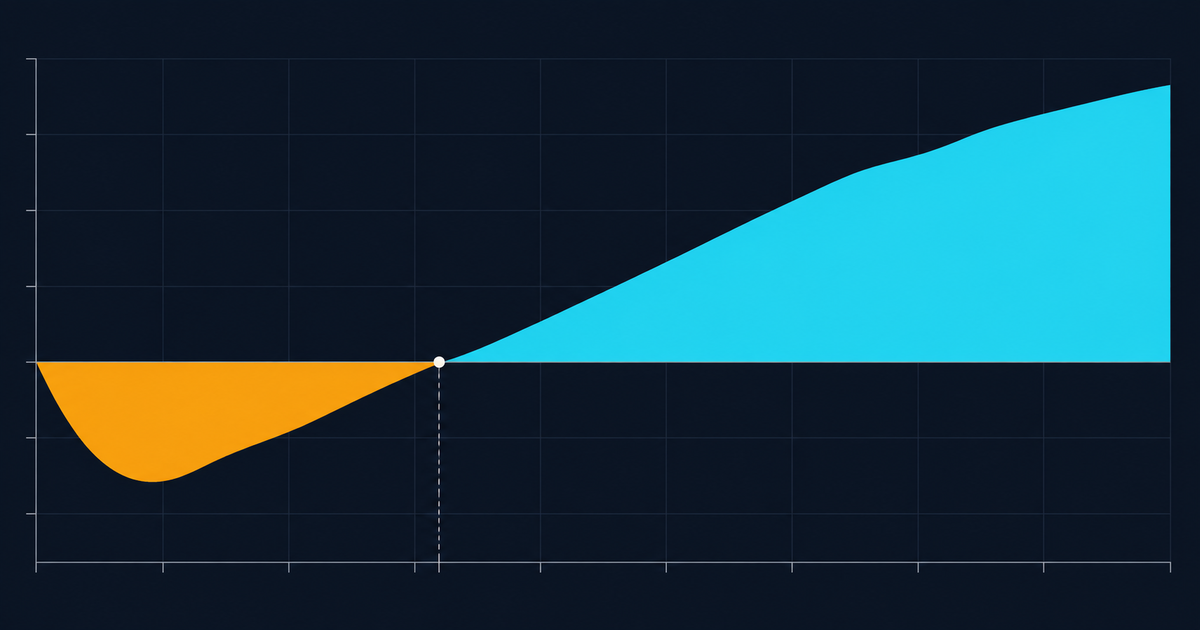
A case that understates costs gets one signature and then loses credibility for the next three years. Use the full stack from what enterprise DAM costs: licence, implementation, migration, storage, delivery, and people.
Two lines to be specific about, because reviewers look for them and their absence is a tell:
The ongoing people cost. A named role, or a named fraction of one, funded. If the case does not contain this, an experienced reviewer will assume the programme has no owner and price the risk accordingly. They will be right.
Year two and beyond. Renewal uplift, growth in volume, and the second wave of integrations that always follows a successful first wave. A five-year model with realistic growth beats a one-year model with a good first-year discount, and total cost of ownership is the framing your finance team already uses.
Where the real savings hide
Two lines that are often larger than the headline productivity claim and almost never appear in the case.
Delivery and bandwidth. If your organisation currently serves original-resolution images to web and mobile, the saving from automatic format and quality selection is a genuine, measurable infrastructure number. Serving modern formats to browsers that support them typically cuts image payload substantially, and the Cloudinary image optimization documentation covers the automatic format and quality mechanism, with WebP and AVIF support now broad enough that this is not a hypothetical.
Get your current monthly image bytes from your CDN, model the reduction, and price it at your actual rate. It is one afternoon of work and it produces a number from an existing invoice, which puts it in benefit category one rather than category four.
There is a revenue side to this too, which is worth stating carefully rather than overclaiming: image weight is a primary input to Largest Contentful Paint, and page performance affects conversion. Do not put a conversion uplift number in the case unless you can run the test. Do mention the mechanism.
Storage multiplication. If every crop and format is a stored file, you are paying for the master times some multiple, forever. Count the distinct masters in your current library, count the total files, and the ratio is your multiplier. In a derived-rendition model it goes to one. That arithmetic is covered from the architecture side in single source of truth is an architecture.

Benefits to leave out
Three that weaken a case by being in it.
“Improved brand consistency.” Real, important, and unquantifiable. It reads as filler in a financial document. Put it in the strategic narrative, not the model.
“Better collaboration.” Same problem, worse. Finance has seen this phrase in every business case for twenty years and it carries no information.
Vendor-supplied industry benchmarks. “Organisations typically see a 30% reduction in…” Any experienced reviewer knows where that came from. One statistic sourced from the party selling you the thing damages the credibility of every other number in the document.
Structure the document like this
Six sections, ten pages maximum. Longer documents are read less carefully, not more.
- The problem, with evidence from your organisation. One incident, one measured number, one quotable line from the diary study.
- What is being proposed, in one paragraph, without vendor names.
- The cost model, five years, all six lines, with assumptions listed separately so they can be challenged individually.
- The benefit model, four categories, each labelled with its confidence, and each traceable to a source.
- Payback and sensitivity. When does it turn positive, and what happens if benefits land at half. A case that survives its own downside test is a case that gets signed.
- What happens if we do nothing. Usually the strongest section, and usually the shortest. Rights exposure that is already running, migration cost that grows every year you wait, and the specific thing that broke last quarter.
Then commit to measuring it
The final paragraph should name the metrics you will report at six and twelve months, with the baseline stated now. Duplicate ratio, search zero-result rate, image bytes served, licensed assets with a valid expiry date on file.
This is unusual enough that it materially improves your chances of approval, and it also means the benefits get realised rather than assumed. Programmes that do not measure post-implementation are the ones that quietly stop being used, which is the pattern described in why DAM rollouts fail.
Build the requirement set that generates your quotes from the requirements checklist, and if you are still establishing what the category does at all, start at what enterprise DAM actually is.
Leave a Reply